The Statistics and Data Science Club was recently established here at UVM and I attended several meetings. The club organizers noted that they needed some way to relay information to members and they thought a good way to do this would be through a website. Because of my experience from courses and other projects, I felt qualified to take on this task, and I volunteered to create the site.
I spoke with the faculty advisor of the club as well as the interim president in order to create a proposal and make sure we were on the same page. I decided to use this opportunity to learn about creating websites through a new language and framework: Django and Python. I had used Python extensively for general programming, but never for web development. I figured that if I liked it for general purpose programming, then I would probably like it for web design as well.
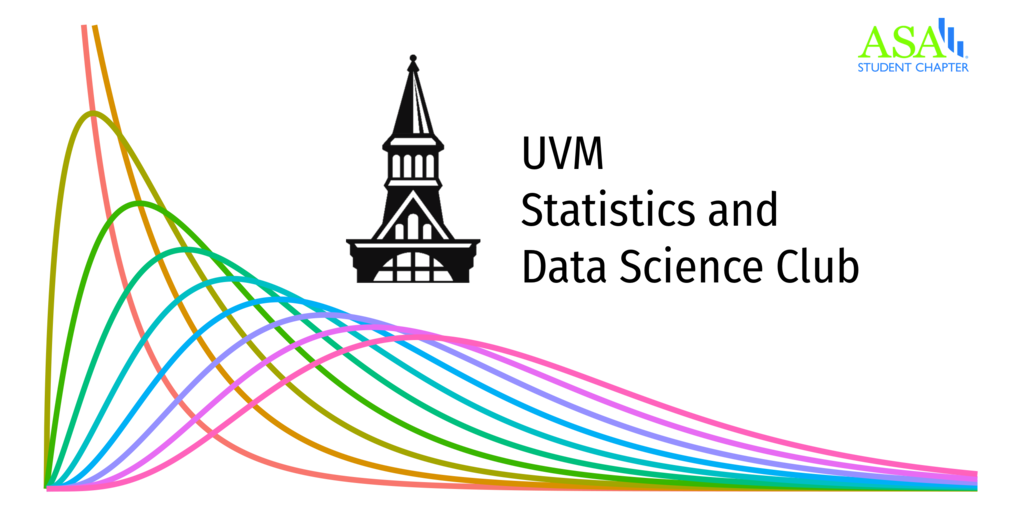
Like any good organization, the club needed to have their own logo, so I also developed one for them. It was an interesting task as I wanted it to be at least somewhat original and also statistically oriented. I ended up utilizing R to produce a series of density plots for chi-squared distributions with varying degrees of freedom. To give it a UVM-twist, I added UVM’s official logo alongside the density plots.
In the year since originally creating the site, the club has become an officially recognized chapter of the American Statistics Association, so I added a small insignia of that association as well. The final logo is below, and I think it came out quite nice even given my unrefined visual design skills.
The repository containing all code for the Statistics and Data Science Club website is located here.